San Diego Real Estate Market: Single-Family Homes
Updated September 11th, 2019. Check out the latest market stats brought to you by my Altos Market Report! Usually, in the real estate industry, the statistics always come from the previous month’s sales, because we want to know what things actually sold for. However, there is not much data out there that shows what is happening in real time! What is so great and unique about this report is that it gives you real-time data on what is happening in the San Diego Real Estate Market with active and pending listings EVERY SINGLE DAY, not just closed sales! You can literally check this report every day and find new data. Pretty amazing!
This week the median list price for San Diego, CA is $919,000 with the market action index hovering around forty-nine. This is about the same as last month’s market action index of forty-nine. Inventory has held steady at around 1,057.
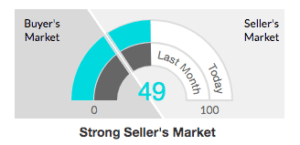
The market action index answers the question “how is the market doing?” by measuring the rate of sale versus inventory. In the last few weeks, the market has achieved a relative stasis point in terms of sales to inventory. However, inventory is sufficiently low to keep us in the Seller’s Market zone so watch changes in the market action index. If the market heats up, prices are likely to resume an upward climb.
Real-Time Market Profile
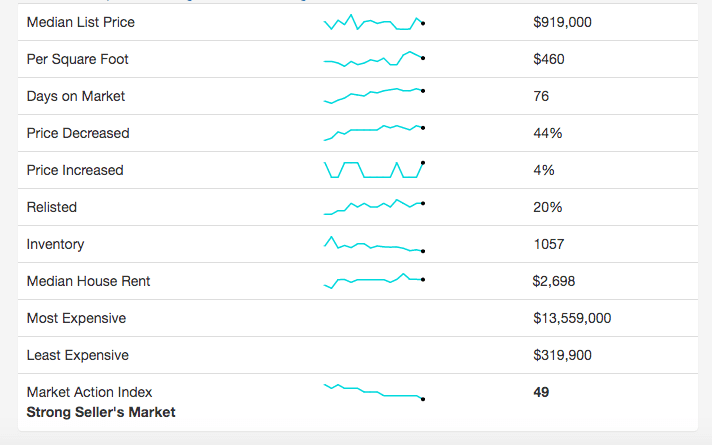
The median list price in San Diego, California is nine hundred nineteen thousand dollars, the median price per square foot is four hundred sixty dollars, the average days on market is 76, forty-four percent of listed homes decreased in price, four percent increased in price, twenty percent of homes on the market are relisted homes, the median house rent is approximately $2,698, the most expensive single-family home is listed at $13,559,000 and the least expensive single-family home is currently listed at $319,900.
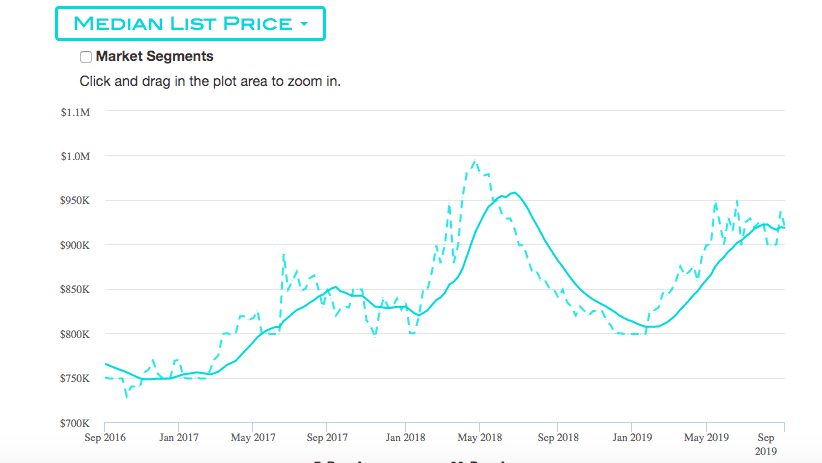
Check out this graph below which shows the median list prices over the years from September 2016 to today. The market is hovering around this plateau. Look for a persistent change in the Market Action Index before we see prices deviate from these levels.
Median List Price
Check out this graph below which shows the median list prices over the years. The market is hovering around this plateau. Look for a persistent change in the Market Action Index before we see prices deviate from these levels. The dotted line represents the seven-day average and the solid line represents the ninety-day average.
San Diego Real Estate Market Segments
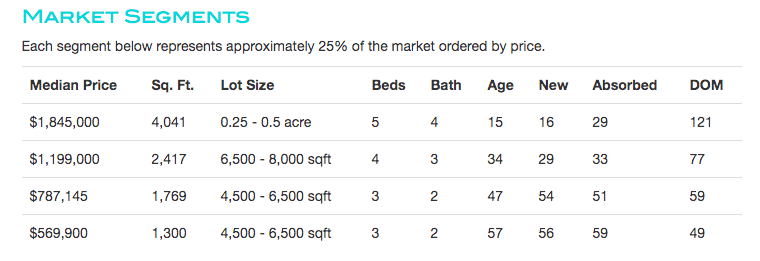
Below shows a graph of the San Diego Real Estate Market ordered by approximately 25% of the price. In the highest-priced quadrant, the median list price is $1,845,000, 4,041 Sq. Ft., 0.25-0.5 acre lots, five beds, four baths, and sits on the market for an average of 121 days.
In the second-highest priced quadrant, the median list price is $1,199,000, 2,417 Sq. Ft., 6,500-8,000 Sq. Ft., four beds, three baths, and spends 77 days on the market.
In the second-lowest price quadrant, the median list price is $787,145, 1,769 Sq. Ft., 4,500-6,500 Sq.Ft., three beds, two baths, and spends an average of fifty-nine days on the market.
In the lowest price quadrant, the median list price is $569,900, 1,300 Sq.Ft., 4,500-6,500 Sq.Ft., three beds, two baths, and spends an average of forty-nine days on the market.
San Diego Real Estate Market: Condos/Townhomes
This week the median list price for San Diego, CA is $529,000 with the market action index hovering around forty-three. This is less than last month’s market action index of forty-five. Inventory has held steady at or around one thousand one hundred eight. Click here to stay informed about the San Diego market!
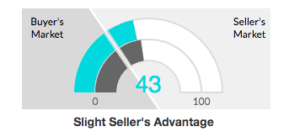
In the last few weeks, the market has achieved a relative stasis point in terms of sales to inventory. However, inventory is sufficiently low to keep us in the Seller’s Market zone so watch changes in the MAI. If the market heats up, prices are likely to resume an upward climb.
Real-Time Market Profile
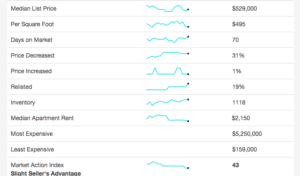
The median list price of condos and townhomes currently in our SD real estate market is $529,000, the price per square foot is $495, the average days on the market is seventy, three percent of listings had a price decrease, one percent had a price increase, nineteen percent of condos and townhomes listed on the MLS have been relisted, the median apartment rent is $2,150, the most expensive home is $5,250,000 and the least expensive condo/townhome is $159,000.
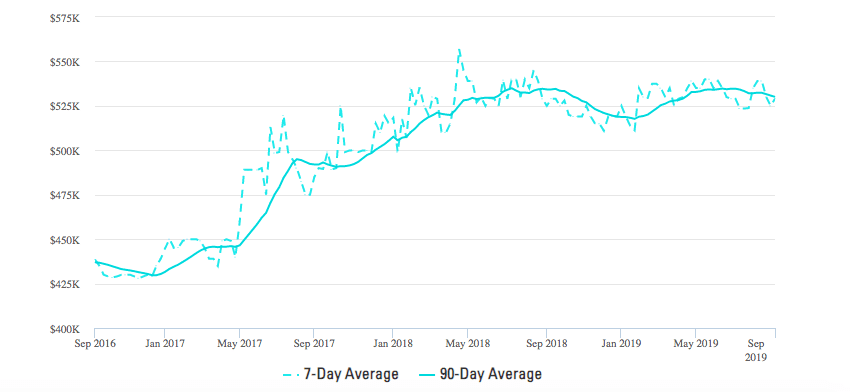
Median List Prices
Check out this graph below which shows the median list prices over the years. The market is hovering around this plateau. Look for a persistent change in the Market Action Index before we see prices deviate from these levels. The dotted line represents the seven-day average and the solid line represents the 90-day average.
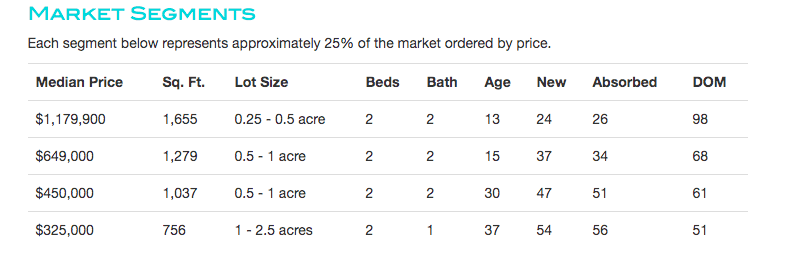
Market Segments
Below shows a graph of the San Diego Real Estate Market ordered by approximately 25% of the price. In the highest priced quadrant, the median list price is $1,179,900, 1,655 Sq.Ft. 0.25-0.5 acre lots, 2 beds, 2 baths, and sits on the market for an average of 98 days.
In the second-highest priced quadrant, the median list price is $649,000, 1,279 Sq. Ft., 0.5-1 acre lot, 2 beds, 2 baths, and spends 68 days on the market.
In the second-lowest price quadrant, the median list price is $450,000, 1,037 Sq. Ft., 0.5-1 acre, 2 beds, 2 baths, and spends an average of 61 days on the market.
In the lowest price quadrant, the median list price is $325,000, 756 Sq.Ft., 1-2.5 acres., 2 beds, 1 bath, and spends an average of 51 days on the market.
In addition to the San Diego Real Estate Market, you can check the market stats for ANY market across the United States using my Altos Market Report! Different markets or neighborhoods all across San Diego differ greatly and all have statistics specific to the neighborhood, even within the same zipcodes. If you have any questions regarding your neighborhood’s real estate market, please do not hesitate to reach out to me! If you are looking for market stats about La Jolla, please visit my hyper-local website which focuses on La Jolla Real Estate.